


🏴☠️ AARRR Template
A basic template to track product metrics using AARRR


With most projects I'm involved with I always like to have some 📈 quantitative data to measure and reflect on. There are various ways to do this with MetaBase, Amplitude etc. However if you are just launching, it’s great to have a simple Scrappy solution to help identify challenges and opportunities to work on.
Common Challenges
Eg.1 Conversion
You might notice you have a high Acquisition rate, however your Activation (sign-up conversion) could be low. This might be an opportunity to take the qualitative approach and have customer interviews or possibly do an A/B test on the landing page to compare messaging.
Eg.2 Retention
You might notice from the data that your retention rate might be low. This might be an opportunity to implement and test some automated insightful drip or status emails that could be low hanging fruit to reminder the users to come back
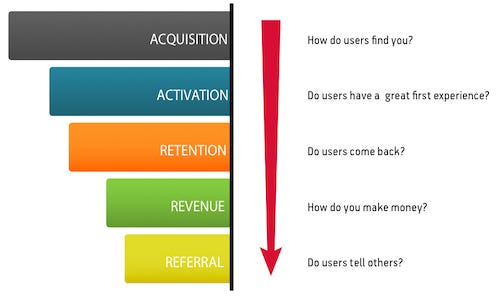
What is AARRR
From a measuring framework, I’ve always been a massive fan of the AARRR framework by Dave McClure (500 Startups). To find out more
Acquisition: Users coming to the site from various channels
Activation: Customers experiencing the core value of the product.
Retention: Customers coming back to use the product again.
Referral: Customers sharing the product with others.
Revenue: Customers spending money in various forms.
Here is the template: https://stayscrappy.gumroad.com/l/aarrr 👈
Pls let me know if you have any feedback 🙏
P.S. If you would like to receive more templates like this, Sign-up to "Stay Scrappy"