

🚗 Pricing for a Marketplace Startup
🚗 Pricing for a Marketplace Startup
A Simple case-study and template to demystify the pricing for a market place start-up

Pricing for startups is 🧬science to start with in the first-place. Try adding some basic Marketplace variables such as supply, demand, growth, churn, CAC, LTV etc. and your head might feel like it’s going to explode 🤯
When you open up your Uber App, it might seem as if pricing is fairly simple. X% straight to the Driver and the difference goes to the marketplace, this feels fairly simple right?
It might seem simple on paper, however you have to wonder why the Giant that is Uber is still struggling to reach profitability.
After helping and advising a few Marketplace startups, I’ve noticed patterns that can apply to most types of Marketplaces that just need to be adjusted by a few variables. I’ve created a case study and template below using ride-sharing to give an example on how to work backwards to optimise pricing.
- Steve Jobs “You have to start with the customer experience and work backwards towards the technology.”
Feel free to follow below and reference the Market Place Pricing Template (👈Click on this link to Download)

Please Note: Uber is just one example of a Ride-share marketplace, there are various other types of Marketplaces that are all modelled over the same principles. Demand, Supply, Price, CAC, Growth etc. All the figures and scenarios are fictitious and in no way relate to Uber
💼 Scenario
There are a bunch of levers to take into consideration when it comes to pricing and profit. Especially if you have a platform that allows you to “book a transaction in the future.”
To make things really simple, let's build a scenario with 1 trip to the airport which costs $25 in either direction and the usual wage that drivers earn is $19, while Uber’s take is $6. However it turns out that the match rates only hit about 60%, this is due to the fact that drivers will only take certain trips that are worth their effort.
🧪 The Experiment
You’ve run a pricing experiment by reducing Uber’s take from $6/ride to $3/ride for a few weeks. This caused the match rates to rise nearly instantly from 60% to roughly 93%. 🎉Wahoo, the experiment worked! Now how do we learn and implement this?
🥅 Levers to consider
Supply and potential Demand to start with
Growth Rate
CAC
Match rates
Churn rates

🤏 Acronyms & Abbreviations
Before jumping in it might be great to explain what a few acronyms mean.
SS = Supply, which is the 🚕 Drivers in this case
DD = Demand, which is the 👋 Riders in this case
Market Place = The business, which is Uber in this case
CAC = Customer Acquisition Cost
Churn = Churn is the percentage rate at which SaaS customers cancel their recurring revenue subscriptions.
Assumptions
🚕 Drivers (Supply “SS”)
CAC is $500
Churn is 20%
Do roughly 100 rides/month when paid the current rate of $19 a trip
👋 Riders (Demand “DD”)
CAC is $10 (however we can optimize this)
Rider Churn ranges from 10% to 33% based on “failed to find driver” attempts
Riders who don’t experience a “failed to find driver” event churn at 10% monthly
riders who experience one or more “failed to find driver” events churn at 33% monthly.
🛣Trips (Jobs)
Flat rate for a trip to Toledo is $25 can’t change
The initial portion to the driver of $19 will change based on “Uber’s take”
“Uber’s take” can range $6/ride to $3/ride, which affects the match rates from 60% to roughly 93%.
i.e. the Driver is more keen on taking rides where they then can earn more money
Please see this table to explain
Here is a simple Diagram to explain the assumptions

🫣 Insights
CAC for Drivers (Supply) is usually expensive upfront, which makes it hard to get to profitability initially.
Growth rates needs to match or better our churn rate for SS and DD
If you optimize CAC for Rider or Driver you can also get to profitability quicker. This is where product managers can get creative
If you start with 5000 Drivers and 45 Riders. At a Driver growth of 9 per month, with a Uber Take of $4.24, we reach optimal yearly profit of -$41,020 with a match rate of 79.3%
Yes it’s negative profit, but it does increase over time.

Please have a look a this sheet for more information
Note: This is without factoring in a change of optimizing the Match Rate or CAC for Riders “DD”. There is an insight to that below 👇

🚕 Drivers (Supply “SS”)
Working backwards, we start off the Drivers as they are the Supply (SS) and know that they can do ±100 rides. (depending on what the Take is for them)
However the 2 levers here are Rider (Supply) and Drivers (Demand) which are affected by Match Rate.
Please note: the CAC is high the first month, as we need to acquire these Riders initially at a rate of $500 each

👋 Riders (Demand “DD”)
Then we move onto the Riders, as they can only match the supply of the Drivers.
The main lever here is Rider churn, which is affected by “failed to find driver”
This is tricky, as we had to split the riders with normal churn of 10% and churn of failed rides being 33%.

💰 Revenue
Once again, you will notice that the initial CAC reduces the initial cash flow, however the profit increases overtime.

My hypothesis is that drivers don’t want to take rides (especially the shorter ones) when the Take is so little and this is what ultimately affects the Match Rate. This also has a ripple effect on the rider churn when they arrive at a “failed to find driver”.
My suggestion is to introduce a tiered Driver Reward program, that will encourage them to take more initial rides to that they can earn more take 🥕. This will hopefully improve the match rate and reduce rider churn.
Please see the table below

Quick scenario on How:
If we keep the Take at $6 and we were able to incentivise the Driver to take more trips that will improve the lowest Match rate from 60% - 70%. Then we will have an increase of profit from -$62,770 to -$11,922 (saving $50,848 🙏🏽) and reduce the rider churn from 21.88% (56,299) to 18.91%. (62,323). Which means you actually reduced churn of 6023 Riders, which is a cost saving of $60,232, as you would have spent $10 per Rider to replace them to keep up with supply.
Note: This is a rough scenario and hasn’t factored in applying the full “Driver Reward program”
Further Notes:
I wouldn’t do this monthly, but rather incentivise them to keep a certain cadence. i.e. They need to keep doing a certain amount of trips per month to keep the status. The Airbnb Superhost is a great example of this
How might we reduce the CAC per new rider
There are various ways to reduce the CAC of a new rider, however a growth-hack referral model comes instinctively.
i.e. Instead of paying $10 to acquire a customer, we are giving away $5 off your next ride for every rider you refer. These programs are proven, but need to be managed carefully.
Working backwards again, if we can reduce our CAC from $10 to $8, we will change our annual profit from -$11,922 to $22,078

Note: You probably can’t reduce the Marketing and Advertising costs to reduce CAC individually, which means this will be new Riders acquired over and above the normal amount.
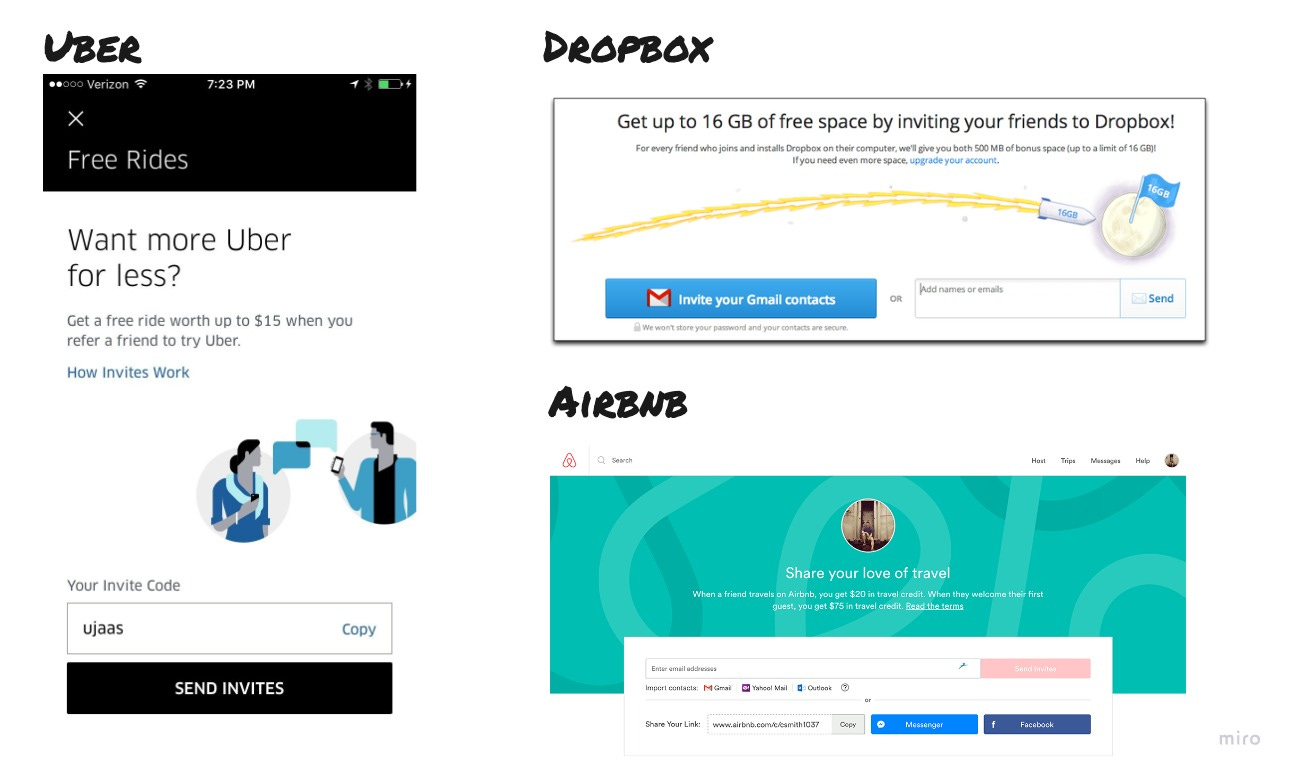
Examples of standard “refer and earn” models

Other issues to solve:
Optimize on Driver Capacity
We would need to identify the max capacity for the Drivers and work backwards to optimize this. To elaborate, if we start with 45 Drivers with a supply of 5000 Riders, our drivers are doing roughly 72 trips per month. If hypothetically they have capacity to do 100 trips, then we should optimize and reduce the Drivers in that area.
Thanks:
I’ve honestly enjoyed putting this together, if you have any feedback, please hit me on Twitter
If you would like to download this Sheet, Go Here 👈
Website: https://garywillmott.com/
Gary’s Greatest Hits: http://bit.ly/garysgreatest
LinkedIn: https://www.linkedin.com/in/garywillmott/
Twitter: https://twitter.com/garywillmott